Add new columns in specified position.
gtable_add_cols(x, widths, pos = -1)
Arguments
| x | a |
|---|---|
| widths | a unit vector giving the widths of the new columns |
| pos | new row will be added below this position. Defaults to
adding col on right. |
Examples
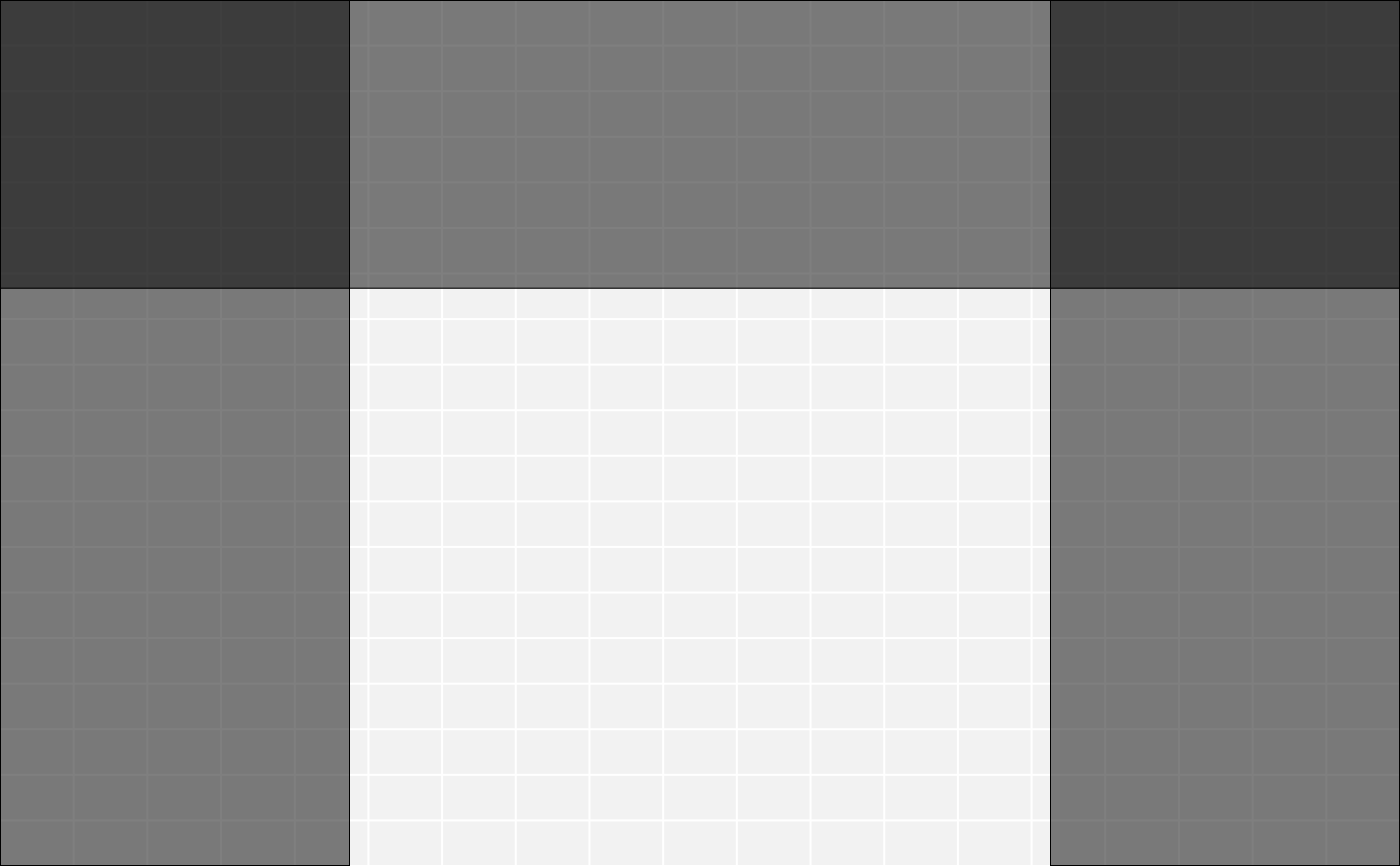
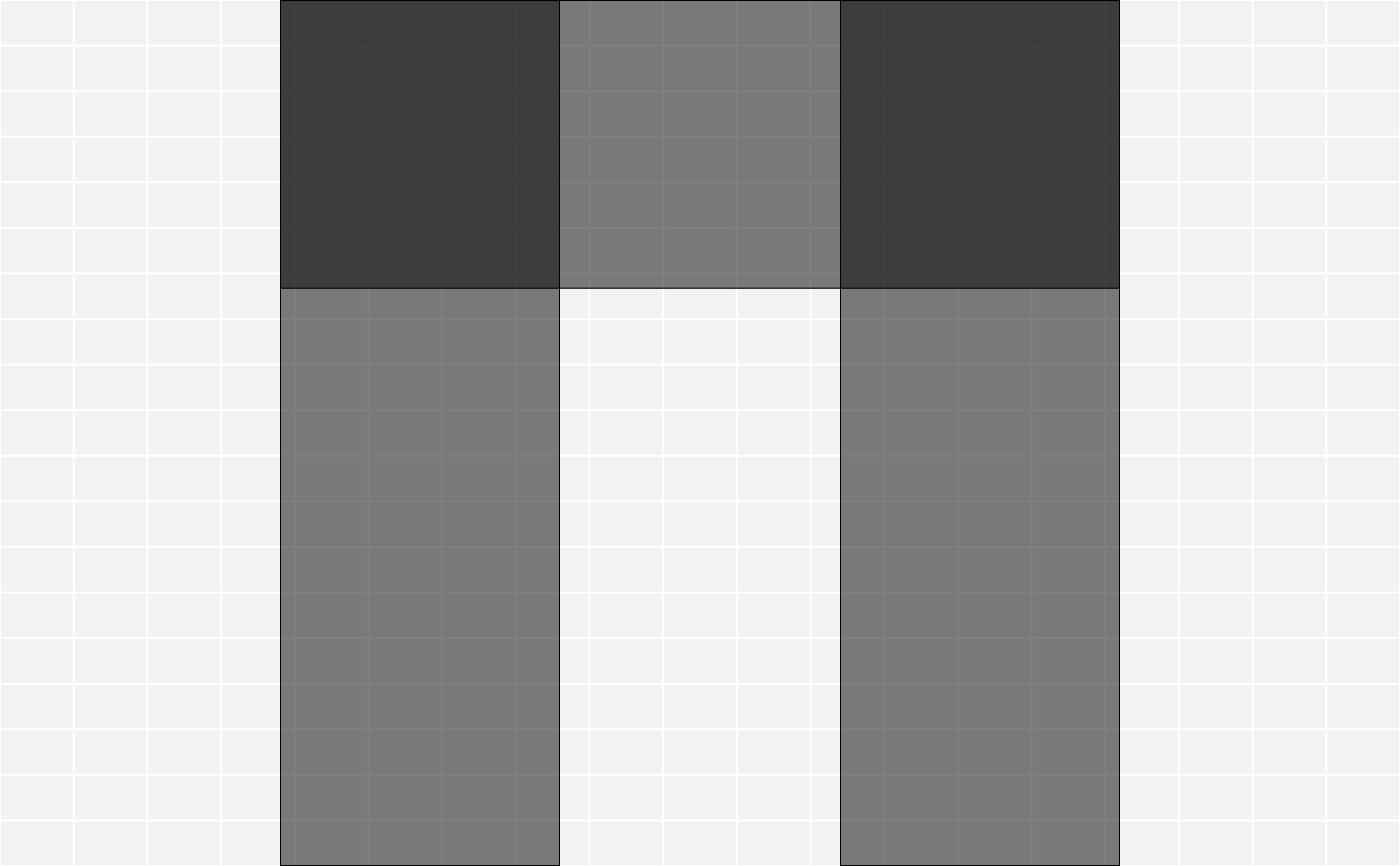
library(grid) rect <- rectGrob(gp = gpar(fill = "#00000080")) tab <- gtable(unit(rep(1, 3), "null"), unit(rep(1, 3), "null")) tab <- gtable_add_grob(tab, rect, t = 1, l = 1, r = 3) tab <- gtable_add_grob(tab, rect, t = 1, b = 3, l = 1) tab <- gtable_add_grob(tab, rect, t = 1, b = 3, l = 3) dim(tab)#> [1] 3 3plot(tab)# Grobs will continue to span over new rows if added in the middle tab2 <- gtable_add_cols(tab, unit(1, "null"), 1) dim(tab2)#> [1] 3 4plot(tab2)# But not when added to left (0) or right (-1, the default) tab3 <- gtable_add_cols(tab, unit(1, "null")) tab3 <- gtable_add_cols(tab3, unit(1, "null"), 0) dim(tab3)#> [1] 3 5plot(tab3)